Technical analysis helps you make smart choices when trading cryptocurrencies. It gives you insights into market trends and potential price movements. Let’s explore some important tools that can help you in the crypto market. These tools can help you make better decisions and maybe even increase your trading success.
Think of technical analysis like being a detective for the crypto market. You look at charts and numbers to guess where prices might go next. It’s all about finding patterns in how prices move, looking at past data, and using different tools to predict what the market might do. This can help you decide when to buy or sell your crypto.
Key Takeaways for Technical Analysis in Crypto Trading
- Use technical analysis to predict market trends and inform trading decisions
- Essential tools include Moving Averages, RSI, Bollinger Bands, and MACD
- Combine technical analysis with fundamental analysis for a complete approach
- Implement risk management: set stop-loss orders and size positions carefully
- Keep learning and adapting to the ever-changing crypto market
- Practice with demo accounts and paper trading before using real money
- Choose a secure cryptocurrency wallet for real trading
- Understand candlestick charts to identify support and resistance levels
- Use multiple indicators together for more reliable signals
- Consider trading style and experience when choosing analysis tools
- Be aware that no single indicator guarantees market success
- Monitor on-chain metrics for insights into blockchain health
- Track social sentiment to gauge market mood
- Adjust indicator parameters to suit individual trading preferences
- Remember that technical analysis is not guaranteed and involves financial risk
What is Technical Analysis?
Technical analysis is like being a detective for the crypto market. You look at charts and numbers to guess where prices might go next. It’s all about finding patterns in how prices move, analyzing historical data, and using various indicators to predict future market behavior. This can help you decide when to buy or sell your crypto, as well as identify potential entry and exit points for trades.
Unlike looking at the news or what a company does (which is part of understanding blockchain technology), technical analysis focuses on the price itself and the volume of trades. Traders believe that all the important info is already shown in the price, so that’s what they study. This approach is based on the idea that market psychology and supply and demand dynamics are reflected in price movements, making it possible to predict future trends by analyzing past market data.
Basic Tools for Technical Analysis
Let’s start with some simple but powerful tools that form the foundation of technical analysis in cryptocurrency trading:
1. Moving Averages
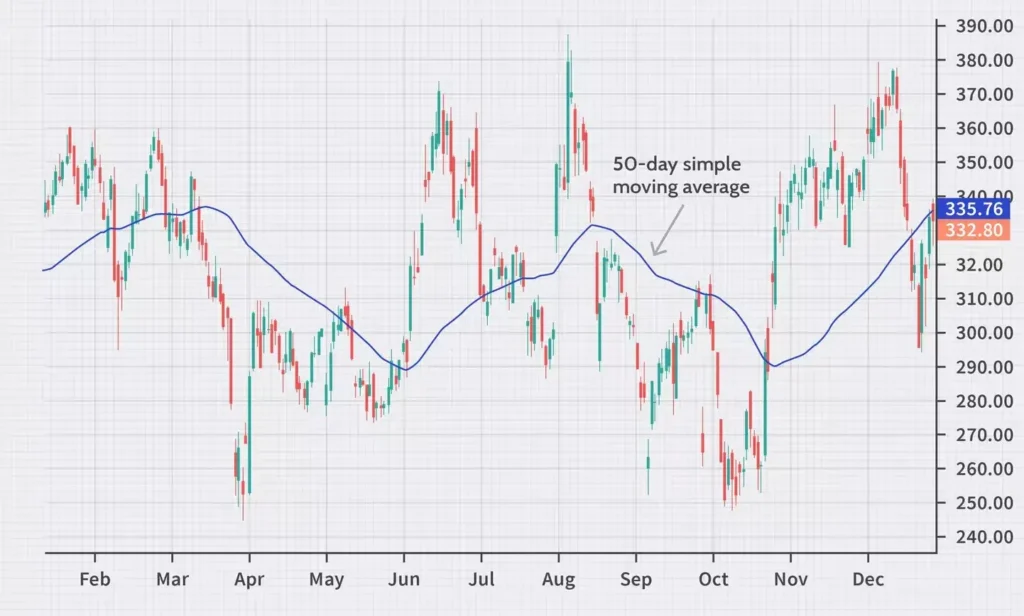
Moving averages are like a smooth line that follows the price, helping to filter out the noise of short-term price fluctuations. They help you see the overall direction without getting distracted by small ups and downs, making it easier to identify trends and potential reversals. There are two main types of moving averages, each with its strengths:
- Simple Moving Average (SMA): This is the average price over a set number of days. It’s calculated by adding up the closing prices for a specific number of periods and then dividing by that number. SMAs are useful for identifying long-term trends and support/resistance levels.
- Exponential Moving Average (EMA): This gives more weight to recent prices, making it quicker to react to changes. EMAs are more responsive to new information and can help traders catch trends earlier than SMAs. They’re particularly useful for short-term trading strategies.
Traders often use these to spot trends and make trading decisions. If the price is above the moving average, it might be a good time to buy as it indicates an uptrend. If it’s below, it might be time to sell as it suggests a downtrend. Additionally, when shorter-term moving averages cross above longer-term ones, it’s often seen as a bullish signal and vice versa for bearish signals.
2. Relative Strength Index (RSI)
The RSI is like a speedometer for price changes, measuring the speed and change of price movements. It goes from 0 to 100 and is typically used to identify overbought or oversold conditions in a market:
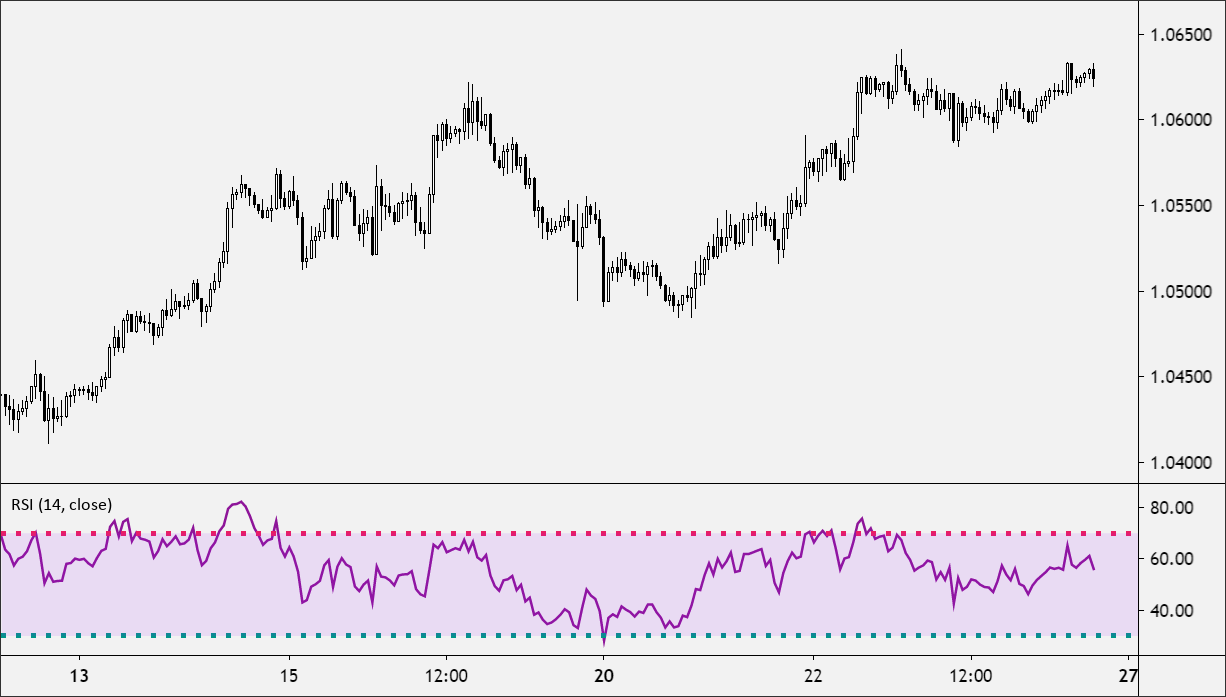
- Above 70: The crypto might be “overbought” and due for a price drop. This suggests that the asset may be overvalued and could be heading for a pullback.
- Below 30: The crypto might be “oversold” and due for a price rise. This indicates that the asset may be undervalued and could be poised for an upward movement.
This tool can help you guess when a price might change direction, potentially signaling good entry or exit points for trades. But remember, in strong trends, RSI can stay high or low for a long time, so it’s important to use it in conjunction with other indicators and market analysis. Traders also look for divergences between the RSI and price action, which can signal potential trend reversals.
Advanced Technical Analysis Tools
As you get more comfortable with basic tools, you can explore some more complex ones that offer deeper insights into market behavior and potential trading opportunities:
1. Bollinger Bands
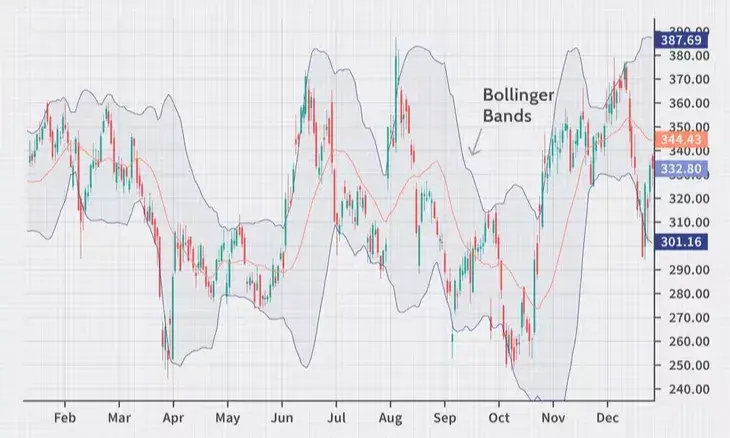
Bollinger Bands are like a tunnel around the price, consisting of a middle band (usually a 20-day simple moving average) and an upper and lower band. They show you when the market is calm or excited, helping to identify potential breakouts and measure market volatility:
- Wide bands: The market is very active and prices are changing a lot, indicating high volatility. This could signal potential trend reversals or continuations.
- Narrow bands: The market is quiet and prices aren’t moving much, suggesting low volatility. This often precedes a significant price move, as periods of low volatility are typically followed by high volatility.
When the price touches the top or bottom band, it might bounce back toward the middle band. This can help you guess when to buy or sell. Traders also look for “Bollinger Squeezes,” where the bands come very close together, often signaling an impending sharp price movement.
2. MACD (Moving Average Convergence Divergence)
The MACD is like a compass for trends, using two moving averages to generate buy and sell signals. It consists of the MACD line, the signal line, and the histogram. This indicator helps traders to:
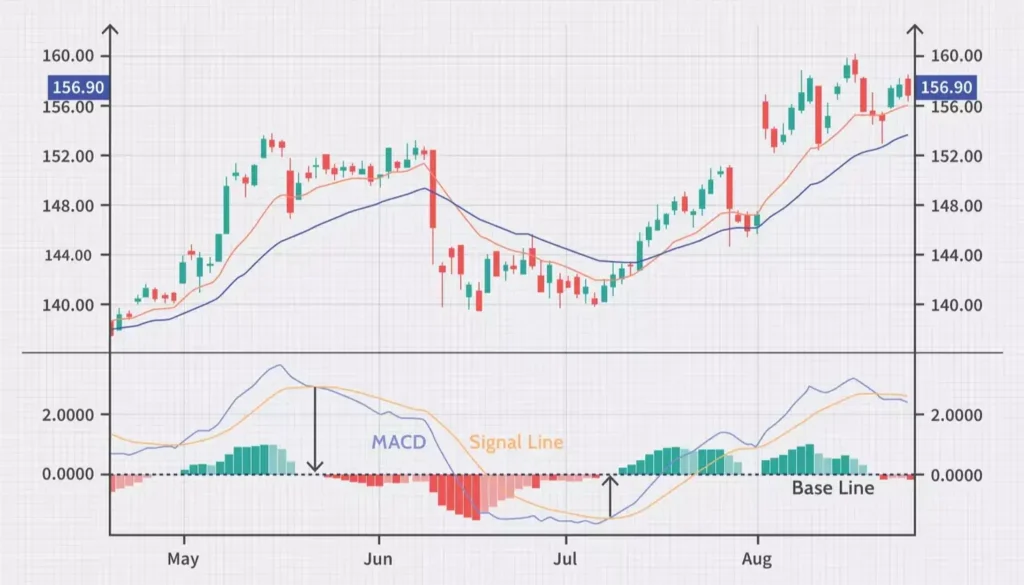
- Identify when a trend might be starting by looking at crossovers of the MACD line and signal line
- Determine when a trend might be ending by spotting divergences between the MACD and price action
- Gauge how strong the trend is by examining the histogram’s size and direction
Traders look for when the MACD lines cross each other to spot possible buy or sell moments. A bullish signal occurs when the MACD line crosses above the signal line, while a bearish signal is generated when it crosses below. The histogram helps visualize the difference between these two lines, with larger bars indicating stronger momentum.
Using Technical Analysis in Different Crypto Markets
Technical analysis works differently depending on what you’re trading, as each cryptocurrency market has its characteristics and behaviors:
Bitcoin
Bitcoin is the biggest crypto, so its charts often show clearer patterns due to higher liquidity and trading volume. This makes it easier to apply technical analysis tools effectively. Understanding Bitcoin ETFs can also help you see how big investors might affect the price, as institutional involvement can significantly impact market trends and volatility.
Altcoins
Smaller cryptocurrencies can be more unpredictable and volatile. You might need to use more tools and be extra careful when trading these. Altcoins often have lower liquidity, which can lead to sudden price spikes or drops. When analyzing altcoins, it’s crucial to consider their correlation with Bitcoin, as many tend to follow Bitcoin’s general trend but with more exaggerated movements.
DeFi Tokens
Tokens used in decentralized finance (DeFi) can move fast and are often subject to rapid changes based on protocol updates, yield farming opportunities and overall DeFi market sentiment. Learning about liquidity pools can help you understand why their prices change and how liquidity affects price stability. When analyzing DeFi tokens, it’s important to consider factors like Total Value Locked (TVL) in the protocol and any upcoming governance votes or protocol changes.
Combining Technical and Fundamental Analysis
While technical analysis is powerful, it’s best when used in conjunction with other types of research to get a comprehensive view of the market:
- Look at the project behind the crypto. Is it solving a real problem? Evaluate the team’s experience, the project’s roadmap, and its adoption metrics.
- Check if any big news events are coming up, such as protocol upgrades, partnerships, or regulatory changes that could impact the price.
- See what the overall market is doing. Is everything going up or down? Understanding market cycles and sentiment can provide context for individual crypto movements.
- Analyze on-chain metrics like active addresses, transaction volume, and network hash rate to gauge the health and growth of the blockchain network.
For example, if you’re interested in DeFi yield farming, you’d want to look at both the price charts and understand how the farming process works. This includes analyzing the APY (Annual Percentage Yield), impermanent loss risks, and the tokenomics of the farming rewards. Combining this fundamental knowledge with technical analysis of price trends can help you make more informed decisions about when to enter or exit yield farming positions.
Staying Safe While Using Technical Analysis
Technical analysis can be exciting and potentially profitable, but it’s important to be careful and implement proper risk management strategies:
- Don’t risk more money than you can afford to lose. Set a strict budget for your trading activities and stick to it.
- Use stop-loss orders to limit potential losses. These automatically sell your position if the price drops to a certain level, protecting you from significant downturns.
- Don’t rely on just one indicator. Use several to confirm your ideas and increase the reliability of your trading signals.
- Remember that past patterns don’t guarantee future results. The crypto market is highly dynamic and can be influenced by many external factors.
- Diversify your portfolio to spread risk across different assets and strategies.
- Keep a trading journal to track your decisions, outcomes, and lessons learned. This can help you refine your strategy over time.
If you’re looking for less risky ways to earn from crypto, learning about staking in DeFi might be a good option. Staking can provide more predictable returns compared to active trading, though it comes with its own set of risks and considerations.
Tools for Practicing Technical Analysis
Before you start trading with real money, it’s smart to practice and hone your skills. Here are some tools you can use to develop your technical analysis abilities:
- TradingView: A popular website for viewing charts and practicing analysis. It offers a wide range of indicators, drawing tools, and the ability to backtest strategies.
- Crypto exchanges often have demo accounts where you can trade with fake money. This allows you to practice in real market conditions without financial risk.
- Paper trading: Keep track of imaginary trades on paper or in a spreadsheet to test your strategies. This helps you develop discipline and track your performance over time.
- Cryptocurrency simulators: These platforms mimic real trading environments and can help you get comfortable with market dynamics.
- Educational resources: Many online courses and tutorials focus specifically on technical analysis for cryptocurrency markets.
While you’re learning, it’s also a good time to choose a secure cryptocurrency wallet for when you’re ready to trade for real. Understanding wallet security is crucial for protecting your assets once you start active trading.
Conclusion: Your Journey with Technical Analysis
Learning about technical analysis tools is just the start of your crypto trading journey. As you delve deeper into the world of cryptocurrency trading, you’ll discover that technical analysis is both an art and a science. It requires practice, patience, and continuous learning to master. Remember these key points as you progress:
- Technical analysis is a valuable tool, but it’s not infallible. Always combine it with other forms of analysis and stay informed about market news and trends.
- Start with basic indicators and gradually incorporate more advanced tools as you gain experience.
- Develop a trading plan and stick to it, avoiding emotional decisions based on short-term market movements.
- Continuously educate yourself about new trading strategies and market dynamics in the ever-evolving crypto space.
- Remember that successful trading is as much about managing risk as it is about identifying opportunities.
As you practice and learn more, you’ll develop your style of analysis and trading strategy that suits your risk tolerance and financial goals. Just remember to always trade responsibly and never invest more than you can afford to lose. With dedication and careful study, technical analysis can become a powerful tool in your cryptocurrency trading arsenal. Happy trading!


